Plot scatter plots of the underlying count data for either TF-peak, peak-gene or TF-gene pairs for a GRN object
plotCorrelations.RdThe user can select multiple filters to plot only pairs of interest. The data that is shown is the same that has been used to construct the eGRN.
plotCorrelations(
  GRN,
  type = "all.filtered",
  TF.IDs = NULL,
  peak.IDs = NULL,
  gene.IDs = NULL,
  min_abs_r = 0,
  TF_peak_maxFDR = 0.2,
  peak_gene_max_rawP = 0.2,
  TF_gene_max_rawP = 0.2,
  nMax = 10,
  nSelectionType = "random",
  dataType = c("real"),
  corMethod = NULL,
  outputFolder = NULL,
  basenameOutput = NULL,
  plotAsPDF = TRUE,
  plotsPerPage = c(2, 2),
  pdf_width = 10,
  pdf_height = 8,
  forceRerun = FALSE
)
Arguments
- GRN
Object of class
GRN- type
Character(1). Default
"all.filtered". Either"TF-peak","peak-gene","TF-gene", or"all.filtered". Default"all.filtered". Which connections to plot?"all.filtered"plots all TF-peak and peak-gene pairs from the filtered eGRN as stored in the object.- TF.IDs
Character(). Default
NULL. Character vector of TF IDs to include. If set toNULL, this filter will be ignored. Only applicable whentype = "TF-peak"ortype = "TF-gene".- peak.IDs
Character(). Default
NULL. Character vector of peak IDs to include. If set toNULL, this filter will be ignored. Only applicable whentype = "TF-peak"ortype = "peak-gene".- gene.IDs
Character(). Default
NULL. Character vector of gene IDs (Ensembl) to include. If set toNULL, this filter will be ignored. Only applicable whentype = "TF-gene"ortype = "peak-gene".- min_abs_r
Numeric[0,1]. Default 0. Filter for all types of pairs: Minimum correlation coefficient (absolute value) required to include a particular pair.
- TF_peak_maxFDR
Numeric[0,1]. Default 0.2. Filter for TF-peak pairs: Which maximum FDR should a pair to plot have? Only applicable when
type = "TF-peak".- peak_gene_max_rawP
Numeric[0,1]. Default 0.2. Filter for peak-gene pairs: Which maximum FDR should a pair to plot have? Only applicable when
type = "peak-gene".- TF_gene_max_rawP
Numeric[0,1]. Default 0.2. Filter for TF-gene pairs: Which maximum FDR should a pair to plot have? Only applicable when
type = "TF-gene".- nMax
Numeric(1). Default 10. Filter for all types of pairs: maximum number of selected pairs that fulfill all other filters that should be plotted. If set to 0, this filter will be disabled and all pairs that fulfill the user-defined criteria will be plotted. If set to a value > 0, different pairs may be selected each time the function is run (if the total number of remaining pairs is large enough)
- nSelectionType
randomortop. Defaulttop. Only applicable ifnMaxis set to a value > 0. If set totop, only the top features will be plotted whilerandomplots randomly selected features.- dataType
Character vector. One of, or both of,
realorbackground. Defaultreal. For which type, real or background data, to produce the diagnostic plots?- corMethod
Character. One of
pearson,spearmanorbicor. Defaultpearson. Method for calculating the correlation coefficient. Forpearsonandspearman, see cor for details.bicordenotes the *biweight midcorrelation*, a correlation measure based on medians as calculated byWGCNA::bicorAndPvalue. Bothspearmanandbicorare considered more robust measures that are less prone to be affected by outliers.- outputFolder
Character or
NULL. DefaultNULL. If set toNULL, the default output folder as specified when initiating the object ininitializeGRNwill be used. Otherwise, all output from this function will be put into the specified folder. If a folder is provided, while we recommend specifying an absolute path, a relative one also works.- basenameOutput
NULLor character. DefaultNULL. Basename of the output files that are produced. If set toNULL, a default basename is chosen. If a custom basename is specified, all output files will have the chosen basename as file prefix, be careful with not overwriting already existing files (ifforceRerunis set toTRUE)- plotAsPDF
TRUEorFALSE. DefaultTRUE.Should the plots be printed to a PDF file? If set toTRUE, a PDF file is generated, the name of which depends on the value ofbasenameOutput. If set toFALSE, all plots are printed to the currently active device. Note that most functions print more than one plot, which means you may only see the last plot depending on your active graphics device.- plotsPerPage
Integer vector of length 2. Default
c(2,2). How man plots should be put on one page? The first number denotes the number of rows, the second one the number of columns.- pdf_width
Number>0. Default 12. Width of the PDF, in cm.
- pdf_height
Number >0. Default 12. Height of the PDF, in cm.
- forceRerun
TRUEorFALSE. DefaultFALSE. Force execution, even if the GRN object already contains the result. Overwrites the old results.
Value
An updated GRN object.
Examples
# See the Workflow vignette on the GRaNIE website for examples
GRN = loadExampleObject()
#> Downloading GRaNIE example object from https://git.embl.de/grp-zaugg/GRaNIE/-/raw/master/data/GRN.rds
#> Finished successfully. You may explore the example object. Start by typing the object name to the console to see a summaty. Happy GRaNIE'ing!
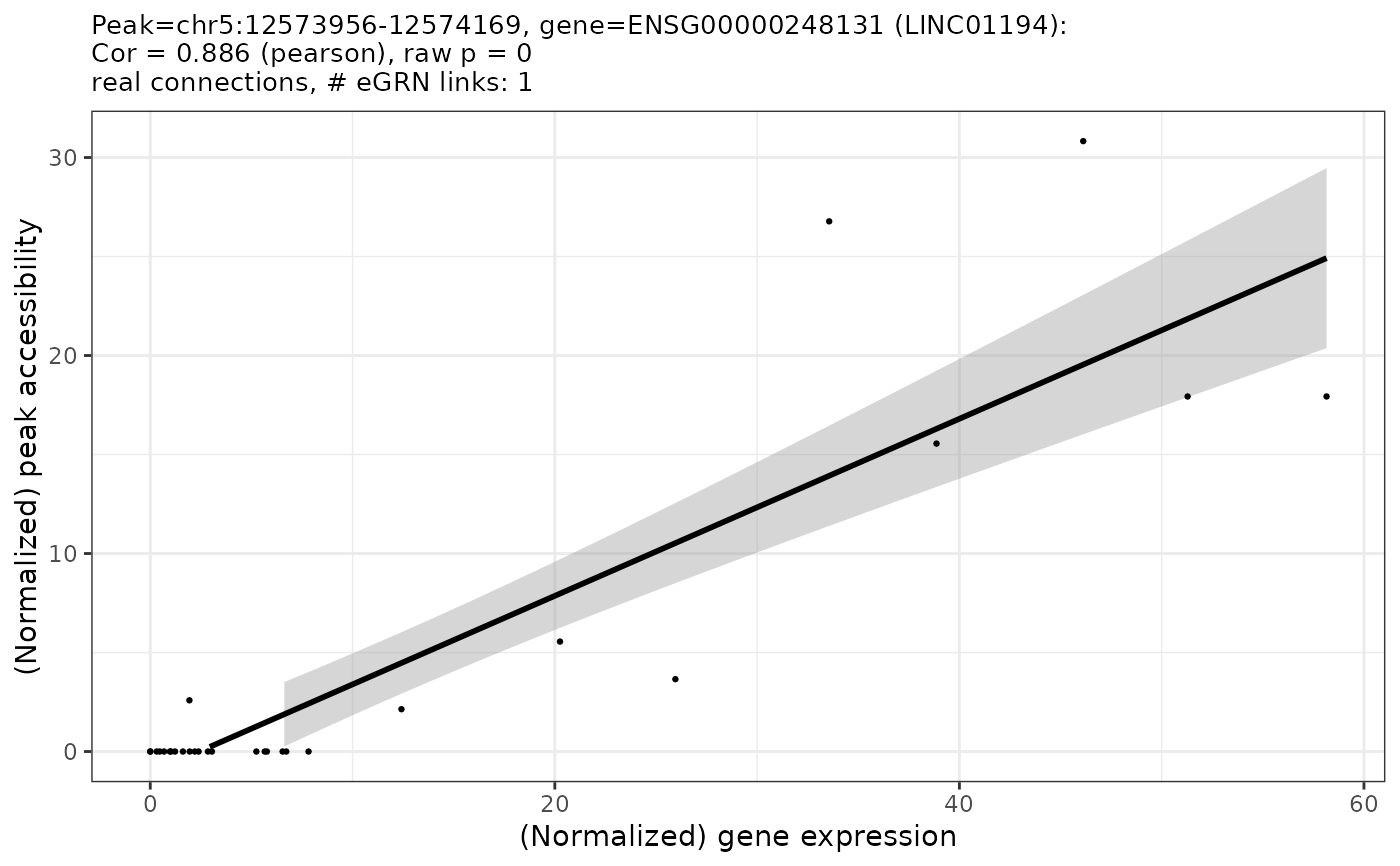
GRN = plotCorrelations(GRN, nMax = 1, min_abs_r = 0.8, plotsPerPage = c(1,1), plotAsPDF = FALSE)
#> INFO [2024-04-04 17:38:58] Plotting correlations for all.filtered
#> INFO [2024-04-04 17:38:58] User-defined filters:
#> Subselection (max=1)
#> FDR (max=0.2)
#> Correlation coefficient (abs) (min=0.8)
#> WARN [2024-04-04 17:38:58] No connections (left) after filtering. No plots are produced. Rerun the function and change the filters..
#> This warning may or may not be ignored. Carefully check its significance and whether it may affect the results.
#>
#> Warning: No connections (left) after filtering. No plots are produced. Rerun the function and change the filters..
#> This warning may or may not be ignored. Carefully check its significance and whether it may affect the results.
#> INFO [2024-04-04 17:38:58] User-defined filters:
#> Subselection (max=1)
#> Raw p-value (max=0.2)
#> Correlation coefficient (abs) (min=0.8)
#> INFO [2024-04-04 17:38:59] Based on user-provided data and filters, 1 pairs remain and will be plotted.
#> INFO [2024-04-04 17:38:59] Preparing plot for peak chr5:12573956-12574169 and gene ENSG00000248131 (LINC01194)
#> INFO [2024-04-04 17:38:59] Plotting directly. This may take a while.
 #> INFO [2024-04-04 17:39:01] Finished writing plots
#> INFO [2024-04-04 17:39:01] Finished successfully. Execution time: 3.8 secs
#> INFO [2024-04-04 17:39:01] Finished writing plots
#> INFO [2024-04-04 17:39:01] Finished successfully. Execution time: 3.8 secs